http_load
软件下载:
http://www.acme.com/software/http_load/http_load-09Mar2016.tar.gz
软件介绍:
程序非常小,解压后也不到100K;http_load以并行复用的方式运行,用以测试web服务器的吞吐量与负载。但是它不同于大多数压力测试工具,它可以以一个单一的进程运行,一般不会把客户机搞死;还可以测试HTTPS类的网站请求。URL路径必需是完整的,否则测试结果不完整。对于http站点比较耗流量及CPU资源、建议使用nice命令执行。测试观察发现能瞬间堆满TCP/IP连接池、可能影响新的连接建立。
源码安装:
[root@WEB1 ~]# tar zxvf http_load-09Mar2016.tar.gz
[root@WEB1 ~]# cd http_load-09Mar2016
# 普通用户编译安装可以更改Makefile文件中的BINDIR和MANDIR值为用户家目录,若要开启https支持则需要指定openssl所在路径;示例:
[root@WEB1 ~]# vim Makefile
|
1 2 3 4 5 6 7 |
SSL_TREE = /usr/local/openssl/ssl SSL_DEFS = -DUSE_SSL SSL_INC = -I$(SSL_TREE)/include SSL_LIBS = -L$(SSL_TREE)/lib -lssl -lcrypto BINDIR = ~/bin MANDIR = ~/bin |
[root@WEB1 ~]# mkdir ~/bin
[root@WEB1 ~]# make && make install
# 说明:请检查~/.bash_profile文件是否有设置变量(PATH=$PATH:$HOME/bin)
使用说明:
|
1 2 3 4 5 6 7 8 |
-p :parallel的简写,指定并发的用户进程数; -f :fetches的简写,指定总计的访问次数; -r :rate的简写,指定每秒的访问频率; -s :seconds的简写,指定总计的访问时间(秒); -timeout :指定空闲连接的超时时间(秒); -proxy :指定代理服务器地址及端口、针对受限网络; -throttle :将访问带宽限制在33.6Kbps; -sip :指定IP记录文件而不是url记录文件; |
测试报告:
示例1:
[root@WEB1 ~]# nice http_load -p 200 -s 10 urls.txt
[root@WEB1 ~]# vim urls.txt
|
1 |
http://www.desenpast.com/503.html |
1180 fetches, 200 max parallel, 495360 bytes, in 10 seconds
419.797 mean bytes/connection
118 fetches/sec, 49535.9 bytes/sec
msecs/connect: 155.837 mean, 2599.07 max, 0.914 min
msecs/first-response: 279.553 mean, 6003.56 max, 0.934 min
28 bad byte counts
HTTP response codes: code 200 -- 1152
结果分析:
发送了1180个请求,最大并发数为200,总的数据传输495360字节,运行时长10.5137秒
每个连接平均的数据传输419.797字节
每秒响应118个请求,每秒传输49535.9字节
平均访问响应时间155.837秒,最长响应时间2599.07毫秒,最小响应时间0.914毫秒
首次访问平均响应时间279.553毫秒,最长响应时间6003.56毫秒,最小响应时间0.934毫秒
总计有28字节传输失败
页面访问的返回代码为200,返回次数1152
示例2:
[root@WEB1 ~]# nice http_load -p 200 -s 10 ipurls.txt
[root@WEB1 ~]# vim ipurls.txt
|
1 |
http://127.0.0.1/503.html |
182350 fetches, 20 max parallel, 7.84105e+07 bytes, in 10 seconds
430 mean bytes/connection
18234.9 fetches/sec, 7.84102e+06 bytes/sec
msecs/connect: 0.134067 mean, 6.454 max, 0.018 min
msecs/first-response: 0.54836 mean, 6.454 max, 0.49 min
HTTP response codes: code 200 -- 182350
连接异常:测试中可能会出现FIN_WAIT1连接过多的问题
清除FIN_WAIT1连接:sysctl -w net.ipv4.tcp_max_orphans=0
还原FIN_WAIT1最大值设置:sysctl -w net.ipv4.tcp_max_orphans=8192
网络连接:
[root@WEB1 ~]# netstat -n|awk '/^tcp/{++S[$NF]}END{for (key in S) print key,S[key]}'
Web Bench
软件下载:
http://home.tiscali.cz/~cz210552/distfiles/webbench-1.5.tar.gz
软件介绍:
Web Bench是Linux下的一个网站压力测试工具,最多可以模拟3万个并发连接去测试网站的负载能力。这个程序解压后不到50K,不支持https协议,耗流量及CPU资源、建议使用nice命令执行。
源码安装:
[root@WEB1 ~]# tar zxvf webbench-1.5.tar.gz
[root@WEB1 ~]# cd webbench-1.5
# 普通用户编译安装可以更改Makefile文件中的PREFIX?值为用户家目录;示例:
[root@WEB1 ~]# vim Makefile
|
1 2 3 4 5 6 7 |
PREFIX?= ~/bin install: webbench install -s webbench $(DESTDIR)$(PREFIX) install -m 644 webbench.1 $(DESTDIR)$(PREFIX) install -d $(DESTDIR)$(PREFIX) #install -m 644 debian/copyright $(DESTDIR)$(PREFIX) #install -m 644 debian/changelog $(DESTDIR)$(PREFIX) |
[root@WEB1 ~]# make && make install
使用说明:
|
1 2 3 4 5 |
-f:不等待服务器的回应; -r:以非缓存重载方式访问; -t:执行压测的时间,默认30秒; -p:指定代理服务器及端口,针对受限网络; -c:指定1次并发访问的客户端数量,默认值1; |
测试报告:
示例1:
[root@WEB1 ~]# nice webbench -c 200 -t 10 http://www.desenpast.com/503.html
Benchmarking: GET http://www.desenpast.com/503.html
200 clients, running 10 sec.
Speed=7194 pages/min, 90108 bytes/sec.
Requests: 1198 susceed, 1 failed.
结果分析:
测试页面:GET http://www.desenpast.com/503.html
200客户端,运行10秒
速率=7194 页/每钟,90108 字节/秒钟
请求数:1198个成功,1个失败
连接异常:测试动态页面可能会导致Web Service与解释器(中间件)连接数溢出,详细信息请参见Web Service错误日志。
ab
软件下载:
http://httpd.apache.org/download.cgi
软件介绍:
ab是Apache自带的一款功能强大的测试工具,安装了httpd-tools就包含了此工具。对于http站点比较耗流量及CPU资源、建议使用nice命令执行。
YUM源安装:
[root@WEB1 ~]# yum -y install httpd-tools
使用说明:
|
1 2 3 4 5 6 7 |
-n:总的请求数(必需大于或等于参数-c的值); -c:并发用户数; -t:总的连接时长; -r:忽略Socket错误; -j:使用HEAD而不是GET; -k:使用HTTP保持功能 -X:指定代理服务器和端口号; |
测试报告:
示例1:
[root@WEB1 ~]# nice ab -r -n 2000 -c 200 -k http://www.desenpast.com/503.html
Concurrency Level: 200
Time taken for tests: 14.643 seconds
Complete requests: 2000
Failed requests: 996
(Connect: 0, Receive: 332, Length: 332, Exceptions: 332)
Write errors: 0
Total transferred: 1254816 bytes
HTML transferred: 717240 bytes
Requests per second: 136.58 [#/sec] (mean)
Time per request: 1464.317 [ms] (mean)
Time per request: 7.322 [ms] (mean, across all concurrent requests)
Transfer rate: 83.68 [Kbytes/sec] received
结果分析:
并发数:200
持续时间: 14.643 秒
总请求数量:2000
失败请求数:996
总的传输量:1254816 字节
HTML传输量:717240 字节
服务器的吞吐量:136.58/秒
用户平均请求等待时间:1464.317 毫秒
服务器平均请求等待时间:7.322 毫秒
每秒获取的数据长度:83.68 KB/秒
连接异常:出现“apr_socket_recv: Connection reset by peer (104)”错误时,请使用-r参数执行。
连接异常:出现“apr_poll: The timeout specified has expired (70007)”错误时,请使用-k参数执行。
httperf
软件下载:
0.9.1版本https://github.com/httperf/httperf/archive/master.zip
0.9.0版本ftp://ftp.hpl.hp.com/pub/httperf/httperf-0.9.0.tar.gz
软件介绍:
Httperf是测量Web服务器性能的工具。它用于生成各种HTTP工作负载和测量服务器性能。httperf的重点不是实现一个特定的基准,而是提供一个强大的、高性能的工具,这有助于构建微观和宏观两个层面的基准。httperf的三大特性分别是生成和维持服务器过载的能力、对HTTP/1.1和SSL协议的支持、新建工作负载生成器和性能的可扩展性测量。对于http站点比较耗流量及CPU资源、建议使用nice命令执行。
源码安装:
[root@WEB1 ~]# unzip master.zip
[root@WEB1 ~]# cd httperf-master && mkdir build m4
[root@WEB1 ~]# yum -y install libtool
[root@WEB1 ~]# autoreconf -i && cd build
[root@WEB1 ~]# ../configure LDFLAGS="-L/usr/local/openssl" --bindir=$HOME/bin --mandir=$HOME/bin
[root@WEB1 ~]# make && make install
编译错误:configure.ac:21: error: possibly undefined macro: AC_PROG_LIBTOOL
解决方法:yum -y install libtool
使用说明:
|
1 2 3 4 5 6 7 8 9 10 |
--num-calls:关闭每个连接前呼叫总数; --num-conns:指定要创建连接的总数; --rate:创建连接或会话的固定速率,并发连接数; --server:指定服务器的IP或主机名; --uri:请求路径(URL路径但不包含主机名); --ssl:启用SSL协议连接,针对HTTPS页面; --timeout:等待服务器响应请求的超时时间,默认不超时值为0; --wsess:创建会话请求,指定N1,N2,X(要生成的会话总数,每个会话的呼叫次数,突发呼叫间隔时间) --burst-length:指定突发呼叫长度N3,每个会话突发呼叫次数为N2/N3; --hog:让httperf使用尽可能多的TCP端口(默认1024~5000); |
测试报告:
示例1:
[root@WEB1 ~]# nice httperf --server www.desenpast.com --port 80 --uri /503.html \
--num-conns 200 --num-calls 100 --rate 2 --timeout 5 --hog
Total: connections 200 requests 15497 replies 15421 test-duration 109.689 s
Connection rate: 1.8 conn/s (548.4 ms/conn, <=35 concurrent connections)
Connection time [ms]: min 115.6 avg 13593.4 max 28481.7 median 13515.5 stddev 6230.3
Connection time [ms]: connect 11.4
Connection length [replies/conn]: 77.105
Request rate: 141.3 req/s (7.1 ms/req)
Request size [B]: 78.0
Reply rate [replies/s]: min 136.0 avg 140.8 max 171.8 stddev 7.2 (21 samples)
Reply time [ms]: response 79.1 transfer 72.4
Reply size [B]: header 316.0 content 430.0 footer 0.0 (total 746.0)
Reply status: 1xx=0 2xx=15421 3xx=0 4xx=0 5xx=0
CPU time [s]: user 20.31 system 85.12 (user 18.5% system 77.6% total 96.1%)
Net I/O: 113.3 KB/s (0.9*10^6 bps)
Errors: total 76 client-timo 75 socket-timo 1 connrefused 0 connreset 0
Errors: fd-unavail 0 addrunavail 0 ftab-full 0 other 0
示例2:
[root@WEB1 ~]# nice httperf --server www.desenpast.com --port 80 --uri /503.html \
--wsess 200,100,1 --rate 2 --burst-length 50 --timeout 5 --hog
Total: connections 417 requests 17529 replies 15543 test-duration 104.794 s
Connection rate: 4.0 conn/s (251.3 ms/conn, <=40 concurrent connections)
Connection time [ms]: min 426.7 avg 6972.6 max 19780.3 median 6293.5 stddev 3581.4
Connection time [ms]: connect 20.4
Connection length [replies/conn]: 37.453
Request rate: 167.3 req/s (6.0 ms/req)
Request size [B]: 80.0
Reply rate [replies/s]: min 136.4 avg 148.2 max 173.2 stddev 7.5 (20 samples)
Reply time [ms]: response 951.3 transfer 56.3
Reply size [B]: header 317.0 content 430.0 footer 0.0 (total 747.0)
Reply status: 1xx=0 2xx=15540 3xx=0 4xx=0 5xx=3
CPU time [s]: user 19.86 system 82.80 (user 19.0% system 79.0% total 98.0%)
Net I/O: 121.3 KB/s (1.0*10^6 bps)
Errors: total 120 client-timo 103 socket-timo 5 connrefused 0 connreset 12
Errors: fd-unavail 0 addrunavail 0 ftab-full 0 other 0
Session rate [sess/s]: min 0.40 avg 0.93 max 1.40 stddev 0.28 (97/200)
Session: avg 2.10 connections/session
Session lifetime [s]: 5.7
Session failtime [s]: 8.8
结果分析:
统计:连接数417,请求总数17529,应答总数15543,测试耗时104.794秒
连接频率:4个连接/秒(251.3毫秒/每连接,并发连接能力小于等于40)
连接耗时:最小426.7毫秒,平均6972.6毫秒,最大19780.3毫秒,中位数 6293.5毫秒, 标准偏差3581.4毫秒
连接耗时:连接20.4毫秒?
连接长度:每连接有37.453个应答的长度
请求频率:167.3个/秒(6.0毫秒/每请求)
请求大小:80字节
响应频率:最小136.4应答/秒,平均148.2应答/秒,最大173.2应答/秒, 偏差7.5应答/秒(20例样)
响应耗时:响应951.3毫秒,传输56.3毫秒
响应长度:响应头317.0字节,内容430.0字节,响应尾0.0字节
响应状态:响应码2xx有15540个
CPU耗时:用户层 19.86秒,系统层 82.80秒 (用户层 19.0%,系统层 79.0%,总共 98.0%)
网络I/O: 121.3 KB/s (1.0*10^6 bps)
错误:总数120个请求,客户端超时103个请求,套接字超时5个请求,连接拒绝0个请求,连接重置12个请求
会话频率:最小0.4会话/秒,平均0.93会话/秒,最大1.40会话/秒, 偏差0.28会话/秒(200个会话成功97个)
会话:平均每个会话发起2.10个连接
会话存活时长:5.7秒
会话失败时长:8.8秒
连接异常:等待时间过长,请使用--timeout参数执行;耗CPU资源过大建议使用nice执行测试指令。
siege
软件下载:
http://download.joedog.org/siege/siege-4.0.4.tar.gz
软件介绍:
一款开源的压力测试工具,可以根据配置对一个Web站点进行多用户的并发访问,记录每个用户所有请求过程的相应时间,并在一定数量的并发访问下重复进行。测试会加载页面所有元素、http或https站点都比较耗流量。
源码安装:
[root@WEB1 ~]# tar zxvf siege-4.0.4.tar.gz
[root@WEB1 ~]# cd siege-4.0.4 && mkdir $HOME/siege
[root@WEB1 ~]# ./configure --prefix=$HOME/siege --with-ssl=/usr/local/openssl/lib
[root@WEB1 ~]# make && make install
[root@WEB1 ~]# export PATH=$PATH:$HOME/siege/bin
使用说明:
|
1 2 3 4 5 6 7 8 9 10 11 12 13 14 15 16 17 |
-C:显示当前配置; -v:打印通知到屏幕; -q:关闭打印通知; -g:GET方式获取HTTP头信息; -p:打印整个页面内容; -c:并发用户数,默认为10; -r:每个用户发起连接的数; -t:持续测试时间,单位s,m,h; -d:每个请求前的延迟时间; -b:每个请求前不延迟; -i:互联网用户模拟,随机访问URL文件中的网页; -f:指定URL文件进行访问; -R:指定siegerc配置文件; -l:指定日志文件,默认路径PREFIX/var/siege.log; -H:向请求添加Header(可以添加多个); -A:设置请求User-Agent参数(浏览器信息); -T:设置请求内容类型,默认类型text; |
测试报告:
示例1:
[root@WEB1 ~]# siege -t 10s http://www.desenpast.com/503.html
Transactions: 1081 hits
Availability: 99.91 %
Elapsed time: 9.97 secs
Data transferred: 0.44 MB
Response time: 0.16 secs
Transaction rate: 108.43 trans/sec
Throughput: 0.04 MB/sec
Concurrency: 16.96
Successful transactions: 1081
Failed transactions: 1
Longest transaction: 4.00
Shortest transaction: 0.00
结果分析:
完成的事务总数:1081次
完成的成功率:99.91%
总共耗时:9.97秒
完成的数据传输量:0.44MB
平均响应时间:0.16秒[总耗时/每用户发起的连接数,9.97/(1081/16.96)]
事务频率:108.43个/秒
吞吐率:0.04MB/秒(40KB/秒)
成功的事务数:1081次
失败的事务数:1次
最长事务耗时:4秒
最短事务耗时:0秒
连接异常:未知原因执行时间过长,请使用-t参数指定执行时间。
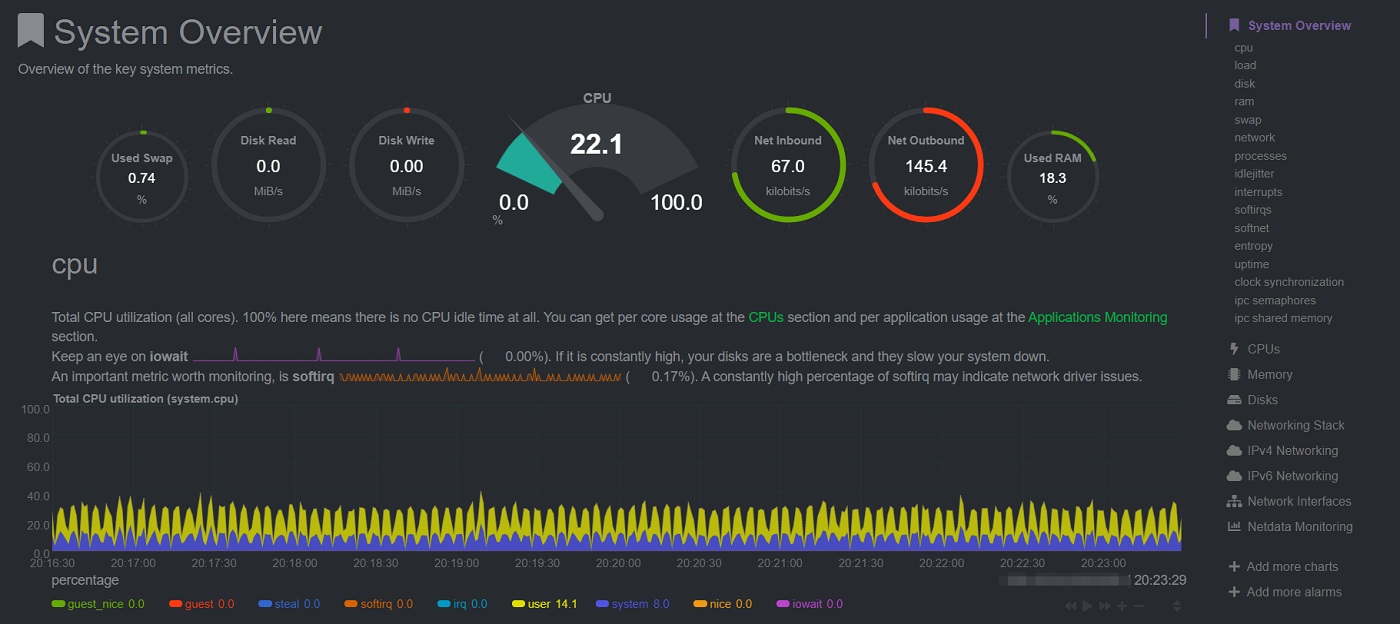
监控:netdata
yum install netdata

systemctl start netdata

firefox http://localhost:19999